Product designer
The Team
Product deisgner
Senior product deisgner
1 PM & founder
3 developers
Key Contributions
Feedback Analysis
Competitive Analysis
Ideation
Design
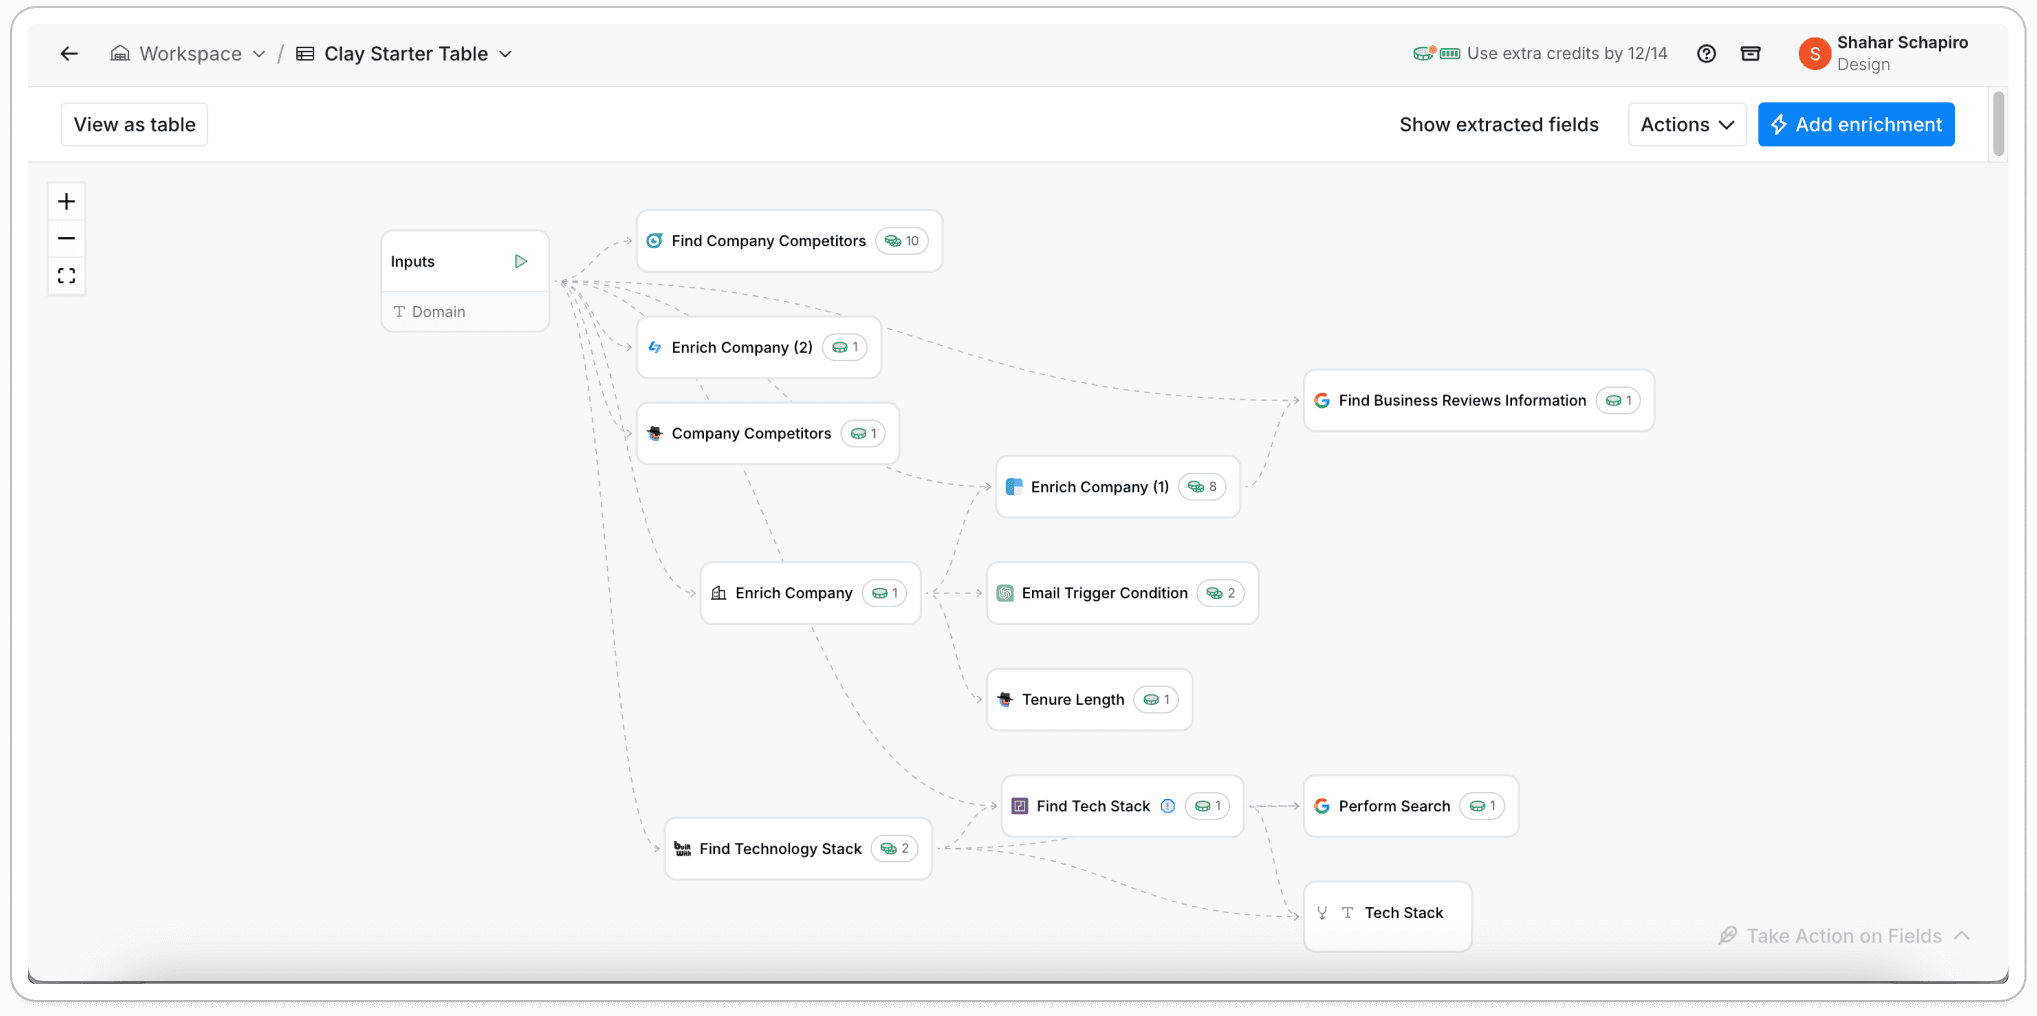
Feature Context
Using the Explore tool chat interface and multiple functions allows analysts to discover new companies, build lists, enhance insights, and gain a comprehensive understanding of a domain.
What are the analysts' pains in domain exploration?
Based on continuous user feedback and customer interviews, we identified two distinct types of analysts using our platform:
Until now, we used AI-generated queries to guide analysts' domain exploration, but the approach had notable limitations.
Repetitive suggestions
Failed to provide market coverageLack of focused queries
Hard to refine research.Challenges in tracking progress
Lack of control over domain exploration.
Suggested questions on chat
This led us to conclude that the issues are lack of confidence and churn of the product.
To refine our understanding of the problem, we framed three key questions:
"How might we improve new-in-domain analysts' coverage within the Explore feature?"
"How might we enhance the depth and thoroughness of domain research?"
"How might we provide analysts with a greater sense of control over the process?"
Exploring Solutions
How does analysts explore domain?

How our competitors solve it?
And do we know similar experiences?


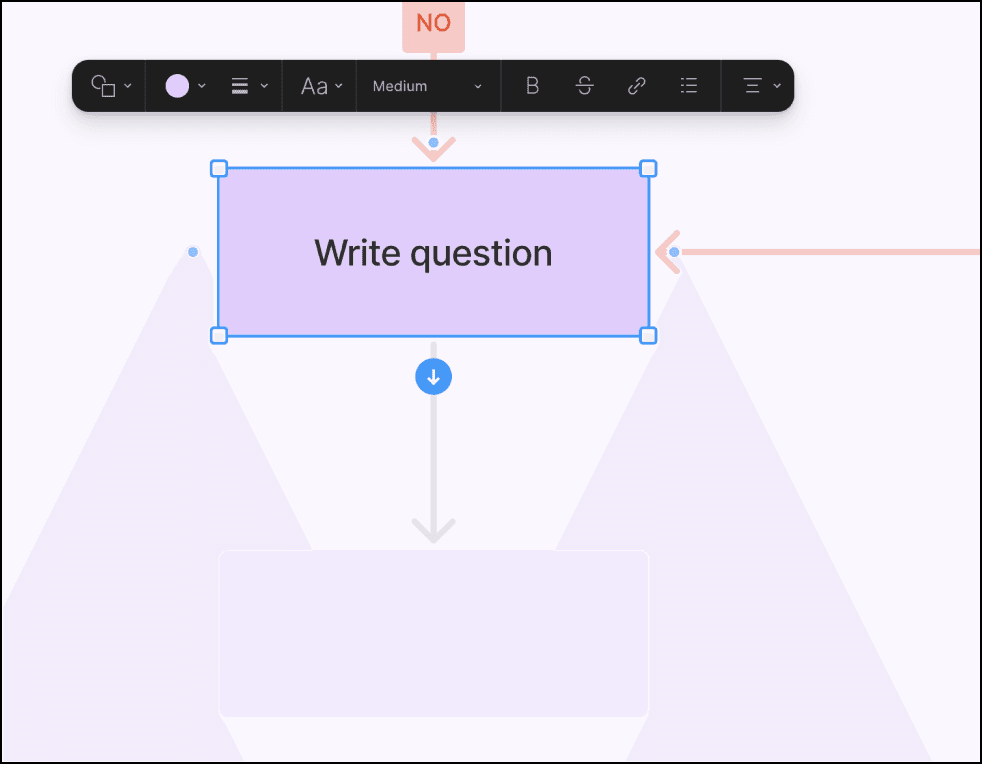
Floting actions bar
1
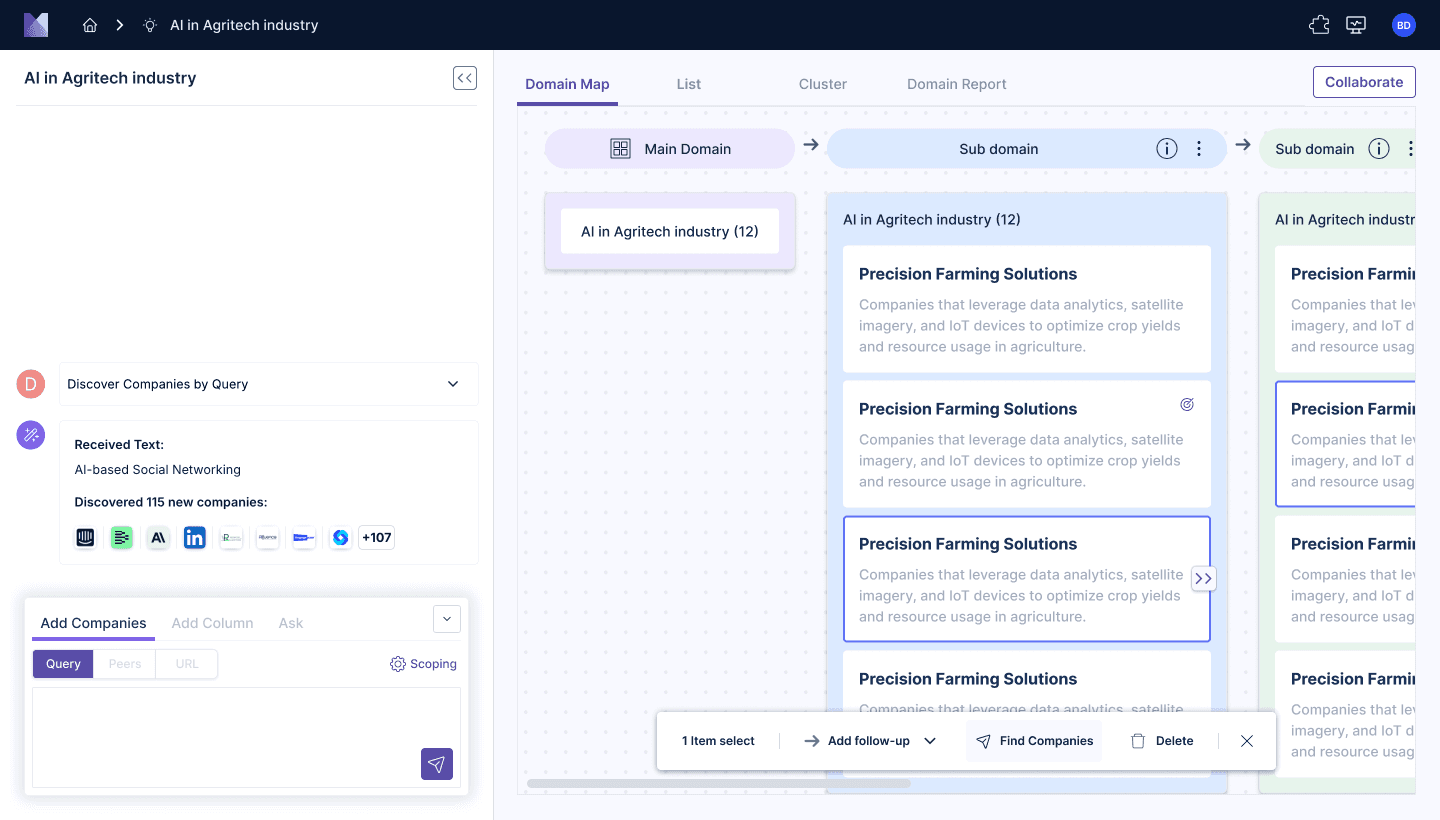
Expanding topics hirerchicly
breaking down domains into clear sub-domains.
2
Intuitive navigation allowing to see relations between topics.
3
Quick new sub-topics discovery
using AI suggestions instead of manual queries.
Transalating research to design
V1 - Inside actions
V2 - Floating actions bar
Changing concept and improving solution
1
Analysts wanted brief descriptions for each sub-domain in each node
2
Navigation felt cumbersome because of excessive scrolling and dragging of the map
The starting node
Generic node
User & Business Impact
70% of our users use this feature on every research
98% of users which used it made at least one level of sub-domain and 60% 2 levels.
80% of users who used this feature, sent a query to find companies, using suggested sub domaons.
Users report that this feature is highly valuable, effective and easy to use in improving their lists and generating qualitative queries to find companies.
These led to larger engagement and satisfaction from the product and especially from the explore tool, which led to better conversion of trial users, and retention of existing ones.